Google Analytics is a powerful tool for understanding how visitors interact with your website. It allows you to track critical data about your audience, discover which pages are most popular, and see how users navigate your site. This information is crucial for making decisions to improve your site’s performance and help your business grow. In this guide, you will learn how to use Google Analytics on websites effectively. By mastering how to use Google Analytics on websites, you can enhance your analytical skills and drive better results.
In this guide, we’ll walk you through the basics of setting up Google Analytics, explain the key metrics you need to know, and show you how to create custom reports. We’ll also share tips for maximizing your data insights so you can make informed decisions and achieve your business goals. Whether you’re new to Google Analytics or looking to improve your skills, this guide on how to use Google Analytics on websites has you covered.
As you progress through this guide on how to use Google Analytics on websites, remember that practical application is key. Experiment with different features and reports to fully grasp how to use Google Analytics on websites to suit your unique needs.

Setting Up Google Analytics
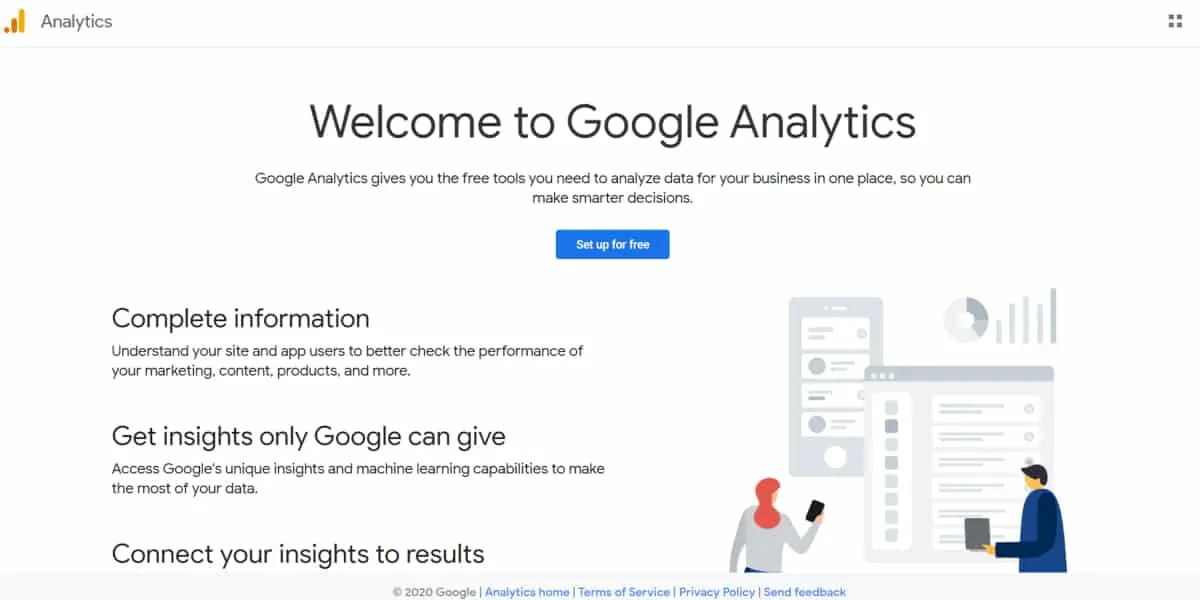
The first step in using Google Analytics is setting it up correctly. To get started, you need a Google account. If you don’t have one yet, create it first. Once you have an account, sign in to the Google Analytics website. Click on the “Start measuring” button to begin the setup process.
When you learn how to use Google Analytics on websites, you will uncover insights that can significantly impact your marketing strategies and overall website performance.
Understanding how to use Google Analytics on websites is essential for any digital marketer looking to optimize their online presence.
You will see a page asking for basic information about your website. Fill in the details, such as your website name, URL, industry category, and time zone. After entering this information, click on the “Create” button. You will be asked to accept the terms of the service agreement. Read through it and then click “I Accept” to proceed.
Next, you will be provided with a tracking code. Google Analytics uses this code to collect data from your website. Copy and paste the code into your website’s HTML before the closing tag. If you use a website builder like WordPress, go to the settings or themes section to add the code. Once the code is added, Google Analytics will start tracking visitor data.
As you analyze your website data, keep in mind the importance of knowing how to use Google Analytics on websites to drive meaningful change.
Regularly reviewing your metrics can help you grasp how to use Google Analytics on websites to enhance user experience.
Understanding how to use Google Analytics on websites will allow you to pinpoint weaknesses in your site’s performance.
Make the most of Google Analytics by learning how to use Google Analytics on websites in a way that resonates with your audience.
As you delve deeper, remember that knowing how to use Google Analytics on websites is a continual learning process.
When creating custom reports, think about how to use Google Analytics on websites to tailor your insights.
Customizing your experience in Google Analytics can enhance your understanding of how to use Google Analytics on websites.
Understanding Key Metrics
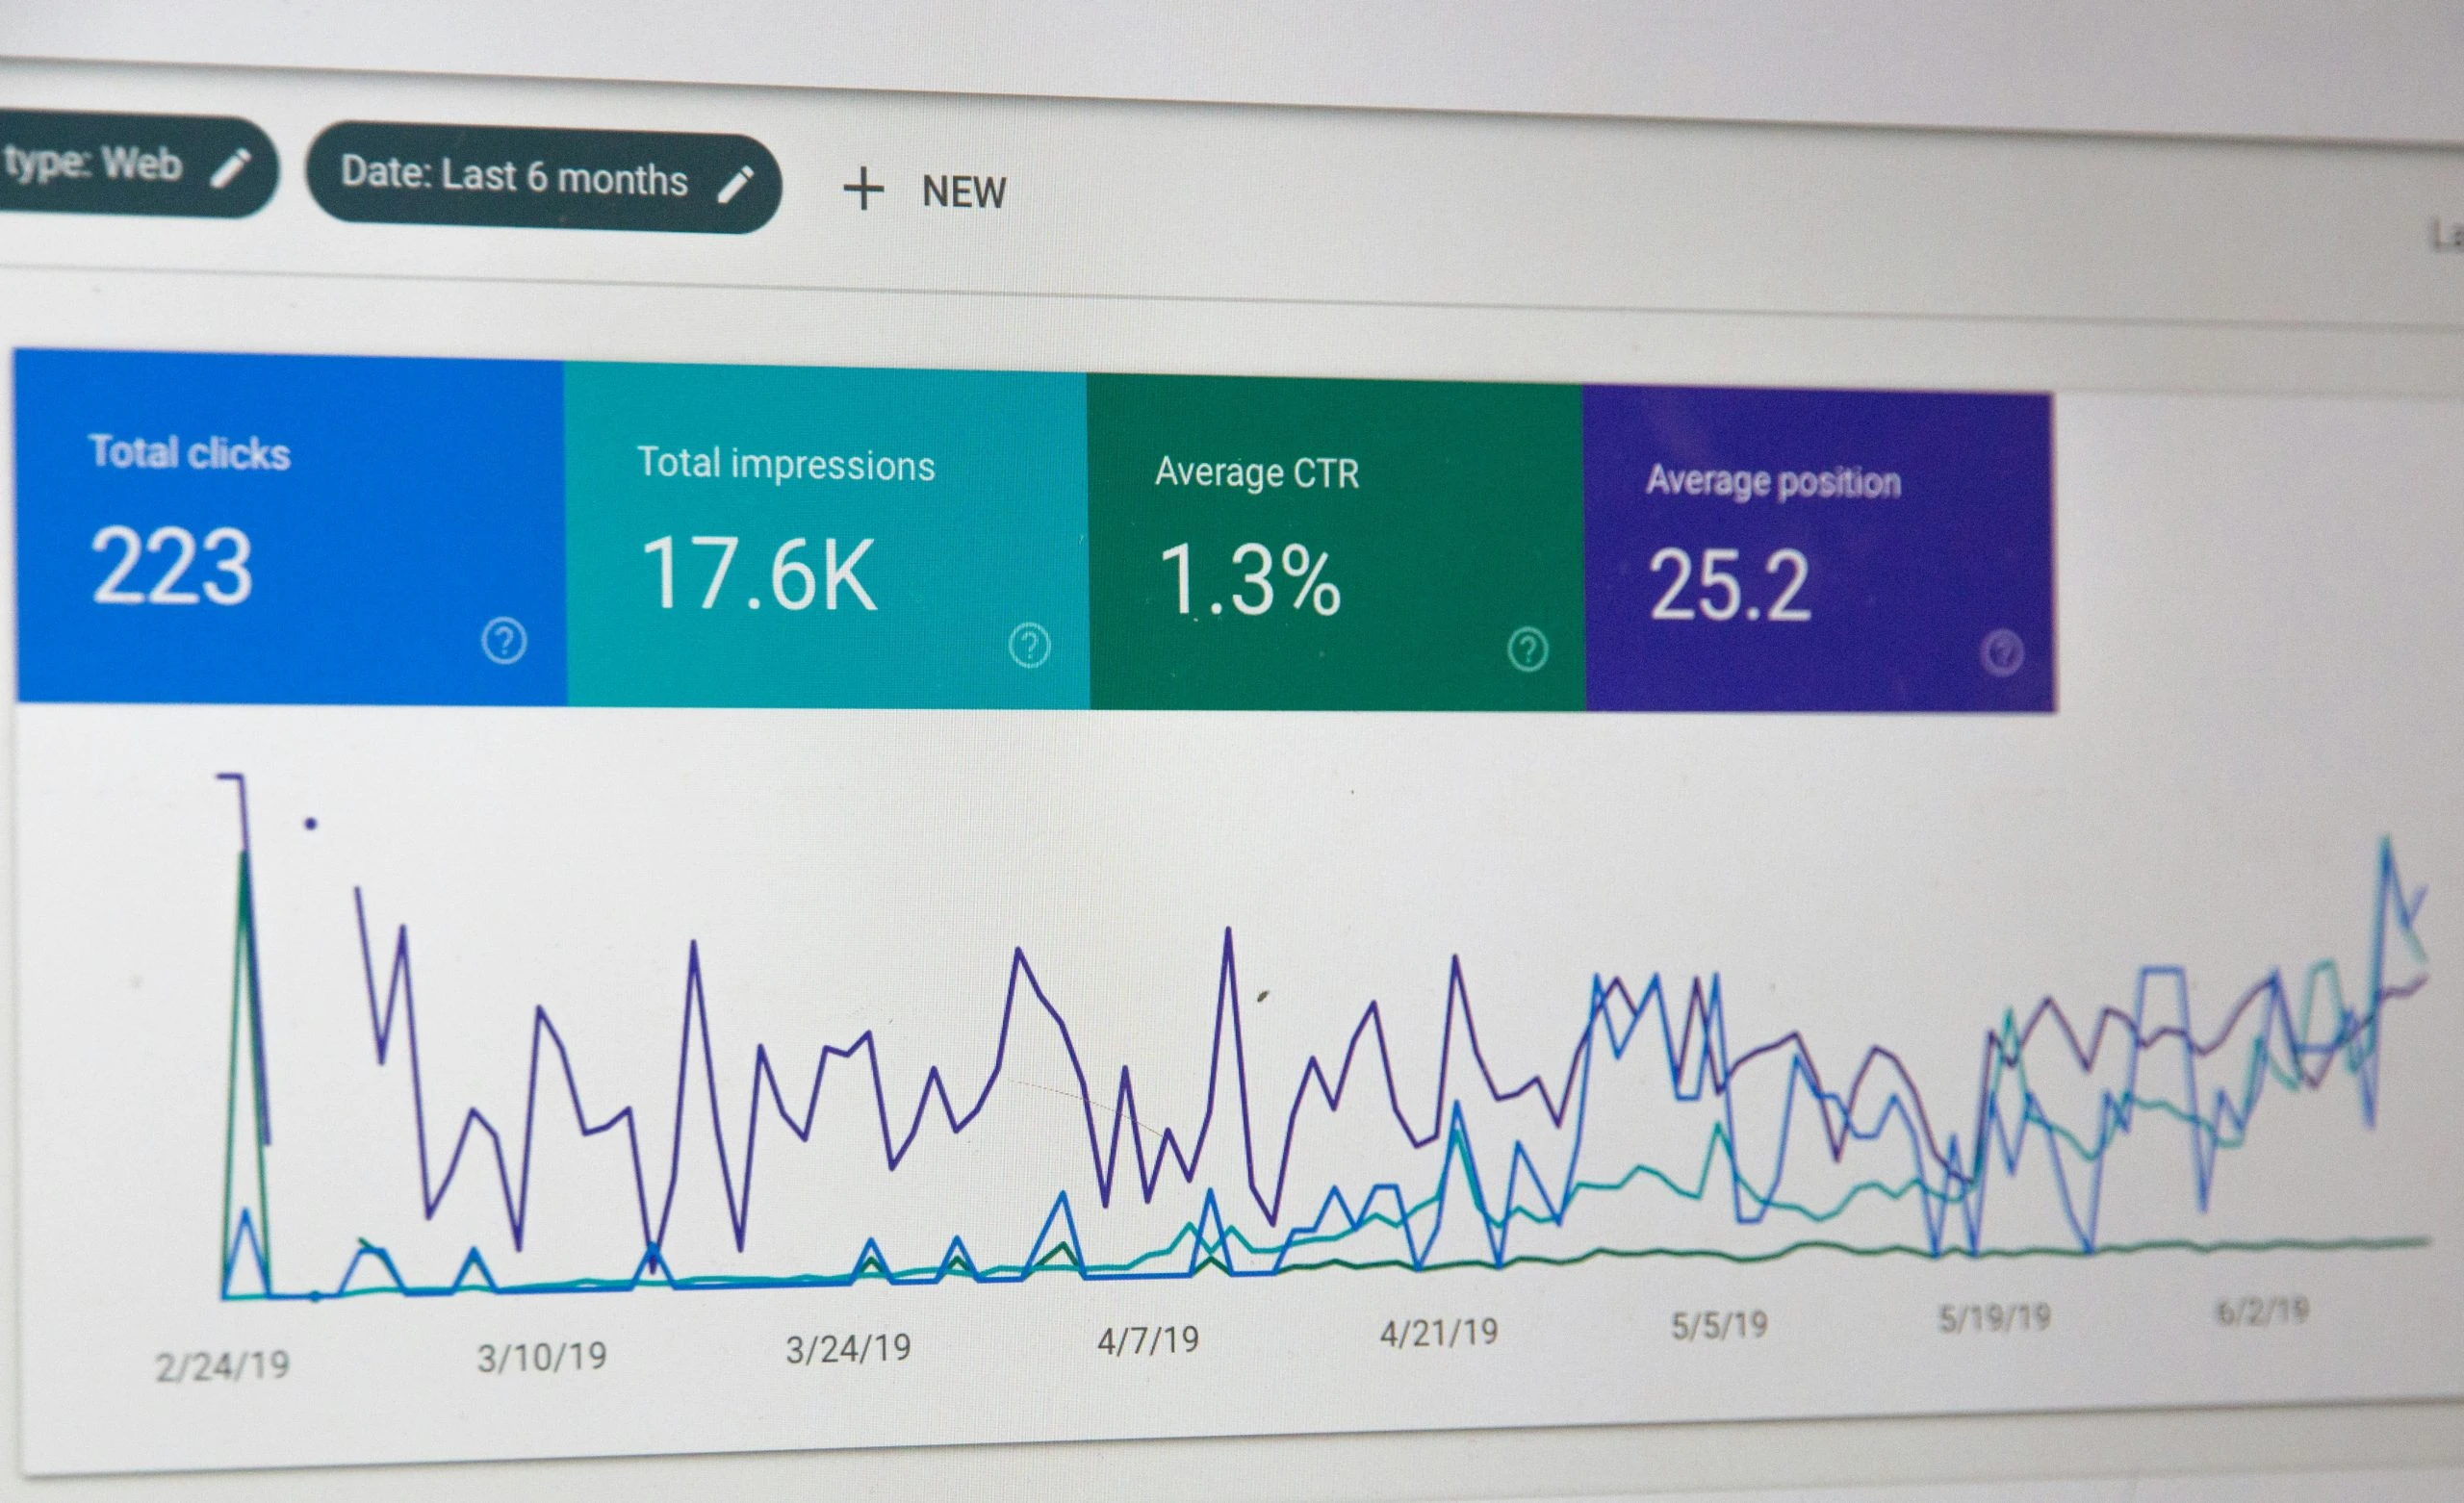
After setting up Google Analytics, the next step is understanding the key metrics. These metrics help you analyze your website’s performance and understand user behaviour. One important metric is “Sessions.” A session represents a single visit to your site. It includes all user interactions within a specific timeframe, like page views, clicks, and events.
Another crucial metric is “Users.” This tells you how many unique visitors come to your site. While sessions can count multiple visits from the same user, the user metric only counts each visitor once. This helps you track how many new visitors you attract over a while.
Another critical metric is the “bounce rate.” It measures the percentage of visitors who leave your site after viewing only one page. A high bounce rate might indicate that visitors aren’t finding what they’re looking for or that the page isn’t engaging. Lowering your bounce rate can lead to more interactions and conversions.
“Average Session Duration” tells you how much time visitors spend on your site during a session. Longer durations usually mean that users are finding your content valuable and engaging. Monitoring this metric helps you understand which pages or content areas need improvement.
Implementing the tips on how to use Google Analytics on websites can significantly enhance your analytical capabilities.
As you set goals, remember to reflect on how to use Google Analytics on websites effectively for tracking your objectives.
Utilizing segmentation can illustrate how to use Google Analytics on websites to enhance your targeting strategies.
By monitoring these key metrics, you can gain valuable insights into your website’s performance and make data-driven decisions to enhance user experience.
As you review your Google Analytics settings, consider how to use Google Analytics on websites to keep your strategies aligned with your goals.
Finally, remember that mastering how to use Google Analytics on websites is crucial for achieving long-term success.
How to Create Custom Reports
Creating custom reports in Google Analytics lets you view the data most important to your business. Start by logging into your Google Analytics account and clicking the “Customization” tab on the left-hand sidebar. Then, select “Custom Reports” and click the “+ New Custom Report” button to create a report tailored to your needs.
First, give your custom report a name that makes it easy to identify. Next, select the metrics you want to include. Metrics are the quantitative measurements such as sessions, bounce rate, or average session duration. You can add multiple metrics to get a comprehensive view of your data.
After choosing your metrics, add dimensions. Dimensions describe the attributes of your data, like the city from which users visit or the device they use. Combining metrics and dimensions helps you segment your data meaningfully, making it easier to draw actionable insights. For example, you might create a report that shows sessions by city, which helps identify where most of your traffic comes from.
Lastly, set any necessary filters to narrow your data to the most relevant. For example, you can filter out internal traffic or focus on specific campaigns. Once everything is set, click “Save” to generate your custom report. You can return to this report anytime and update it as your needs change.

Tips for Maximizing Your Data Insights
Getting the most out of Google Analytics involves more than just understanding key metrics and creating custom reports. Here are some tips to help you maximize your data insights.
First, set up goals and conversion tracking. Goals let you measure how well your site fulfills your objectives. You can track actions like newsletter sign-ups, form submissions, or product purchases. Setting goals helps you understand the effectiveness of your marketing efforts and user interactions.
Second, use segmentation to break down your data into more valuable chunks. For example, create segments for new vs. returning visitors or by geographic location. Segmentation helps you uncover patterns and trends you might not see in aggregated data, enabling more targeted marketing strategies.
Third, Google Analytics’ real-time reports should be taken advantage of. These reports show live data about current users on your site. Use real-time reports to monitor the immediate impact of marketing campaigns, social media posts, or content updates.
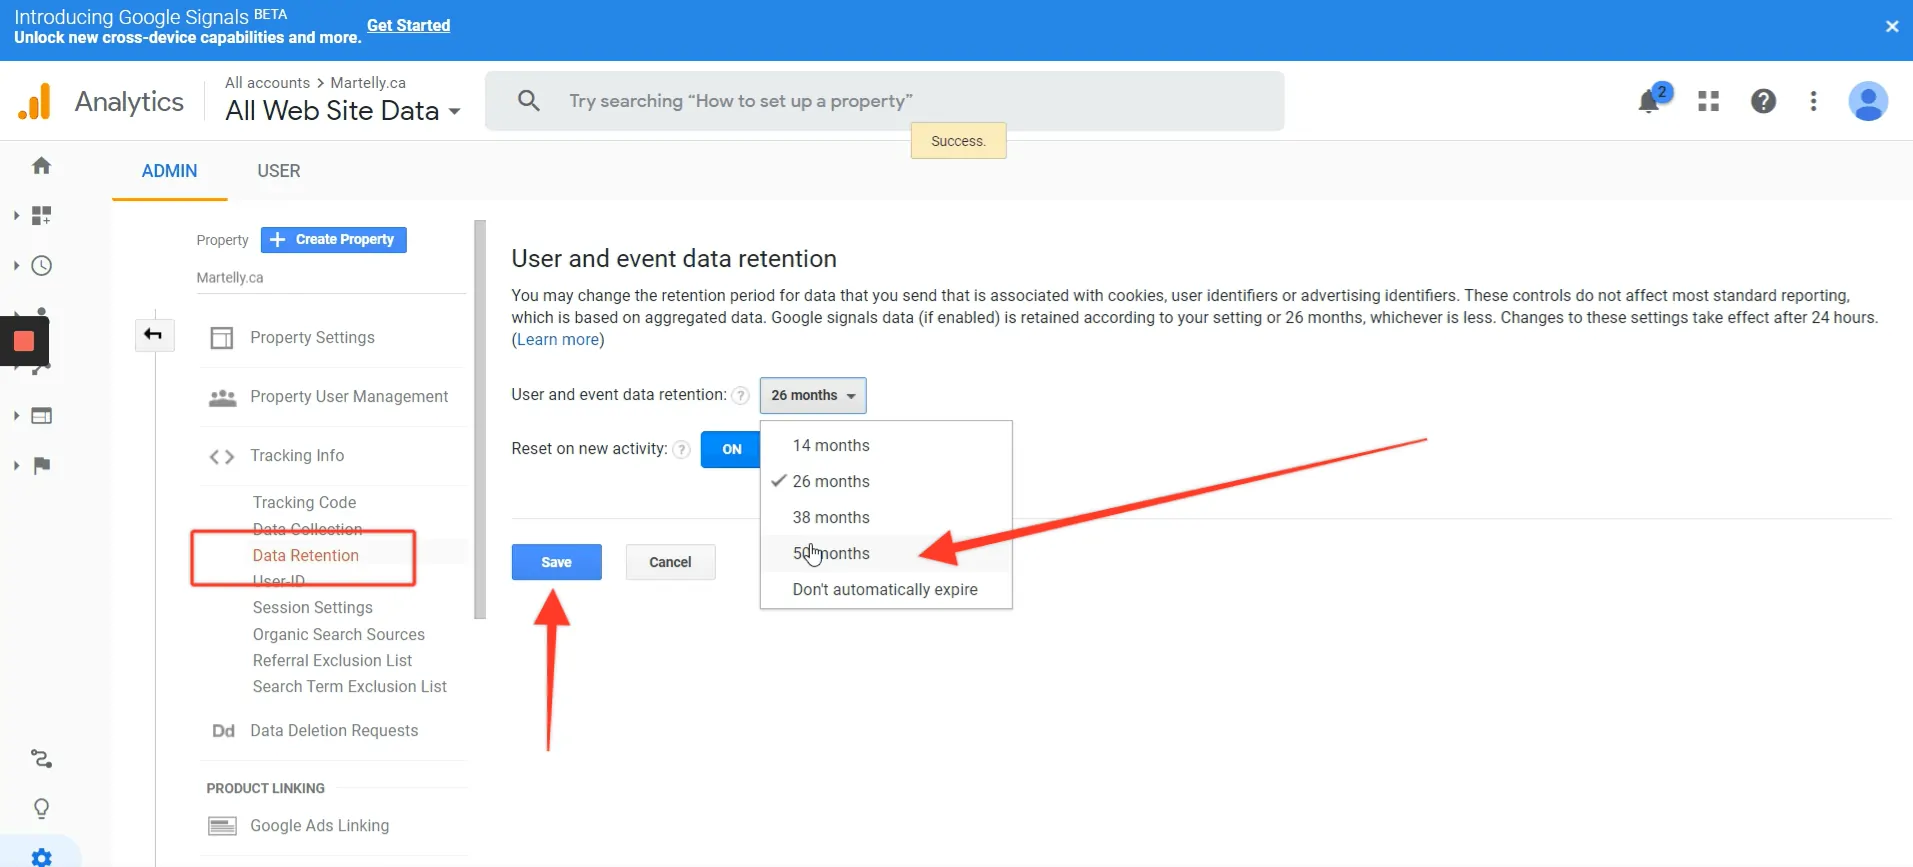
Finally, regularly review and update your Google Analytics settings. Business goals and market conditions change over time. Periodically revisiting your analytics setup ensures you always collect relevant and valuable data. Keeping your account settings fresh aligns your analytics with your current objectives, providing the most beneficial insights.
Google Analytics is critical for understanding your website’s performance and making data-driven decisions. These steps, from setting it up to understanding key metrics and creating custom reports, let you harness the full power of Google Analytics. You can maximize insights and drive your website’s success through goals, segmentation, real-time reporting, and regular review.
Ready to dive deeper into your data? At JAVALOGIX, we specialize in developing digital marketing strategies tailored to your business. Contact our online paid advertising agency today to take your data insights to the next level!